
GOME-2 vertical ozone profile quality assessment by satellite-to-satellite comparison
In the framework of EUMETSAT's AC SAF the Finnish Meteorological Institute participate in the Quality Assessment of the GOME-2 Ozone Profile product by comparing GOME-2 ozone profiles against the ozone profiles retrieved from limb-viewing satellite instruments.
These pages show resulting graphs when the GOME-2 offline high-resolution vertical ozone profiles are compared with ozone profiles from the Ozone Mapping and Profiler Suite Limb Profile (OMPS LP) instrument onboard the Suomi National Polar-orbiting Partnership (NPP) satellite. The OMPS LP version 2.5 daily ozone product has separate retrievals for ultraviolet (UV) and visible (VIS) wavelengths. See the release notes for further information. The OMPS LP daily ozone profile data from center slit is used.
The delay to perform the most recent daily comparison is set to six days to ensure that new OMPS ozone daily data is available.
The preceding monthly results for Metop-A and Metop-B are available from January 2017 onwards, past Metop-C results are added later. Comparison results can be found here.
The latest day comparison results
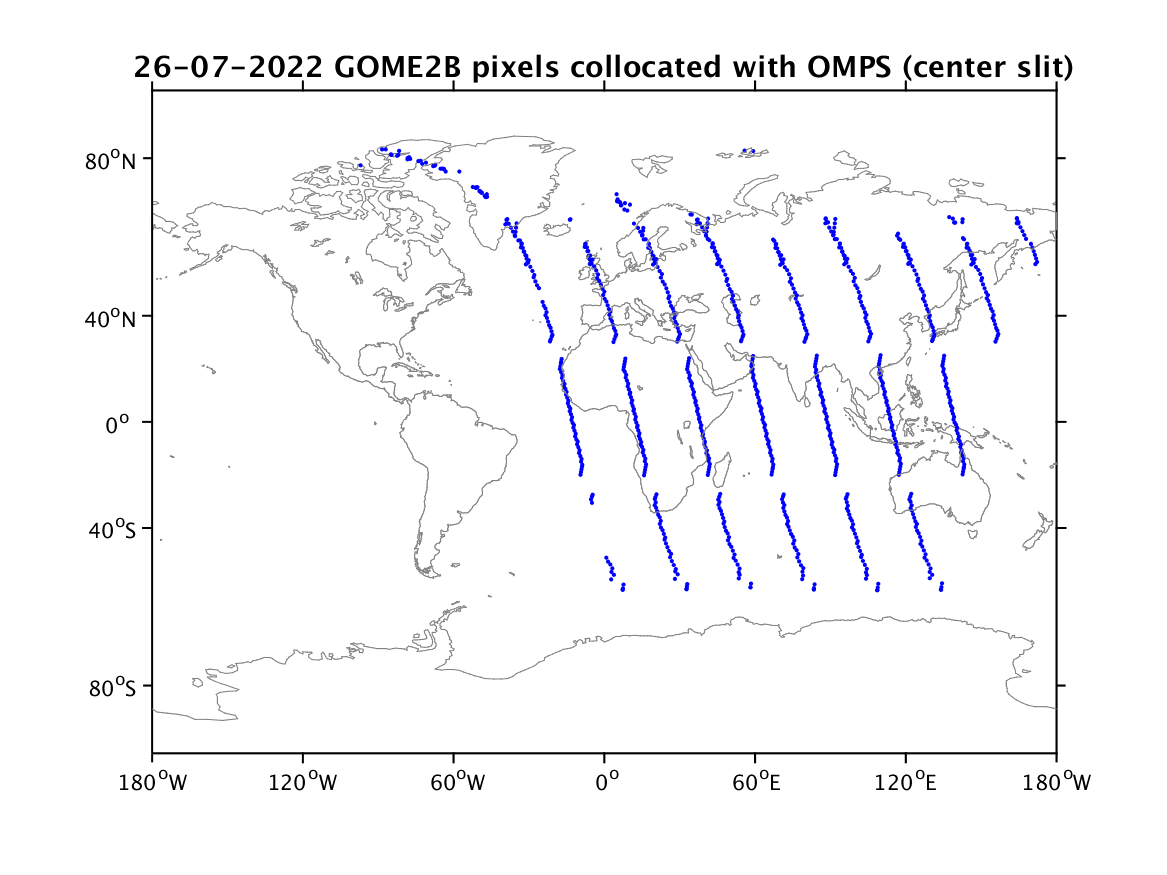
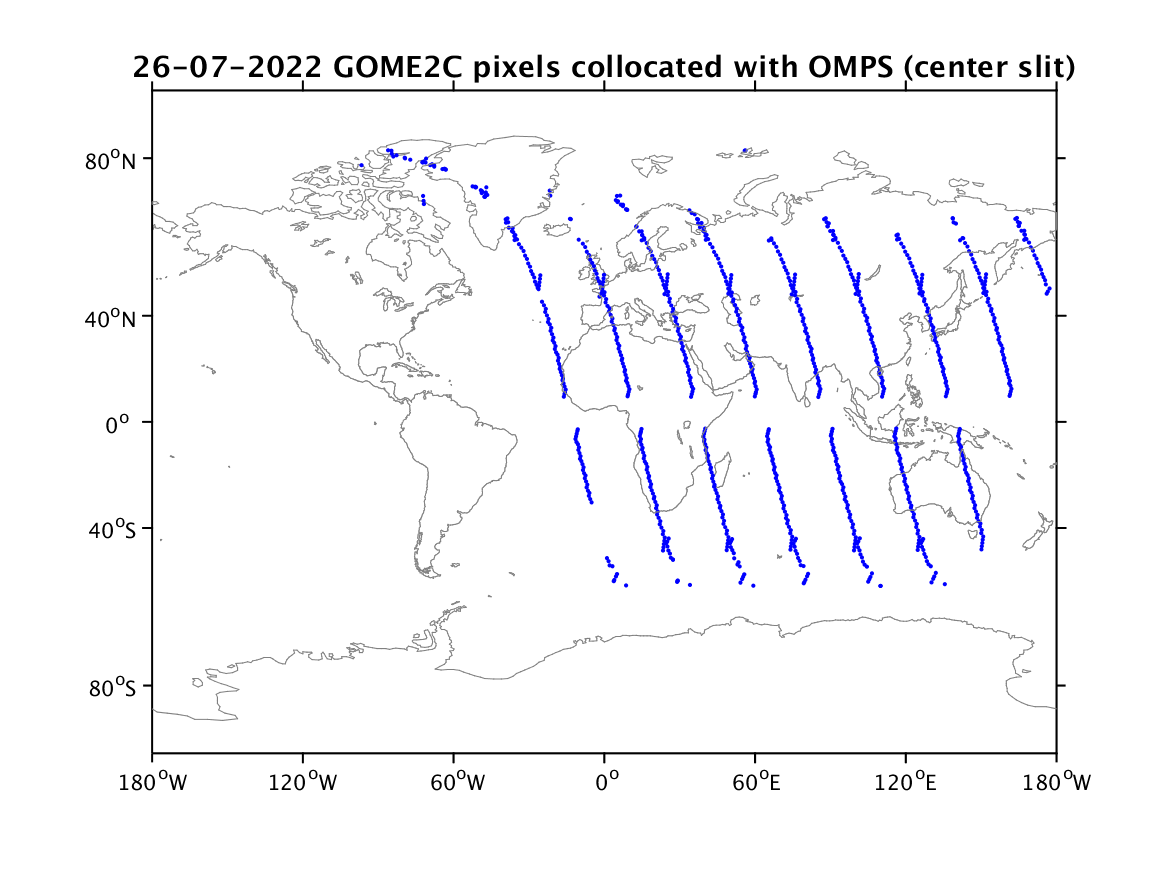
- The comparison includes only geographically and temporally collocated ozone profiles
- The comparison is done independently with VIS and UV OMPS LP version 2.5 ozone retrievals
- The results are shown separately in five latitude zones: 60°-90°N, 30°-60°N, 30°S-30°N, 30°-60°S and 60°-90°S
- The GOME-2 ozone profiles are given as partial ozone columns in Dobson Units (DU) at logarithmically spaced pressure layers
- The OMPS LP ozone densities vs. altitude profiles at 1 km intervals have been converted into volume mixing ratios using ancillary pressure and temperature profiles reported with OMPS LP data. Then OMPS data is interpolated into GOME-2 retrieval pressure layers and converted into partial ozone columns in DU.
- The OMPS LP ozone profiles (both UV and VIS) have been smoothed to the same vertical resolution than GOME-2 ozone profiles by using GOME-2 averaging kernels (avk)
The results are shown for GOME-2/Metop-B and GOME-2/Metop-C individually. Metop-A was deorbited in November 2021.
Metop-B
Data:- GOME-2/Metop-B Offline high-resolution vertical ozone profile product OHP
- OMPS Limb Profiler - Suomi NPP LP-L2-O3-DAILY version 2.5 product (center slit) having separate retrievals for the upper troposphere and lower stratosphere (VIS) and for the middle and upper stratosphere (UV)
| The map of collocated pixels | The mean profiles in five latitude zones |
|---|---|
 |
 |
| Figure 1. Collocation criteria: observations within 12 hours and distance between them is less than 200 km on WGS 84 ellipsoid. | Figure 2. Legend box shows the number of collocations at each latitude zone. Middle and right: The solid curves are for the means of OMPS LP profiles smoothed vertically with GOME-2 averaging kernels and dashed curves without smoothing. |
| The absolute and relative difference of daily means in five latitude zones | |
 |
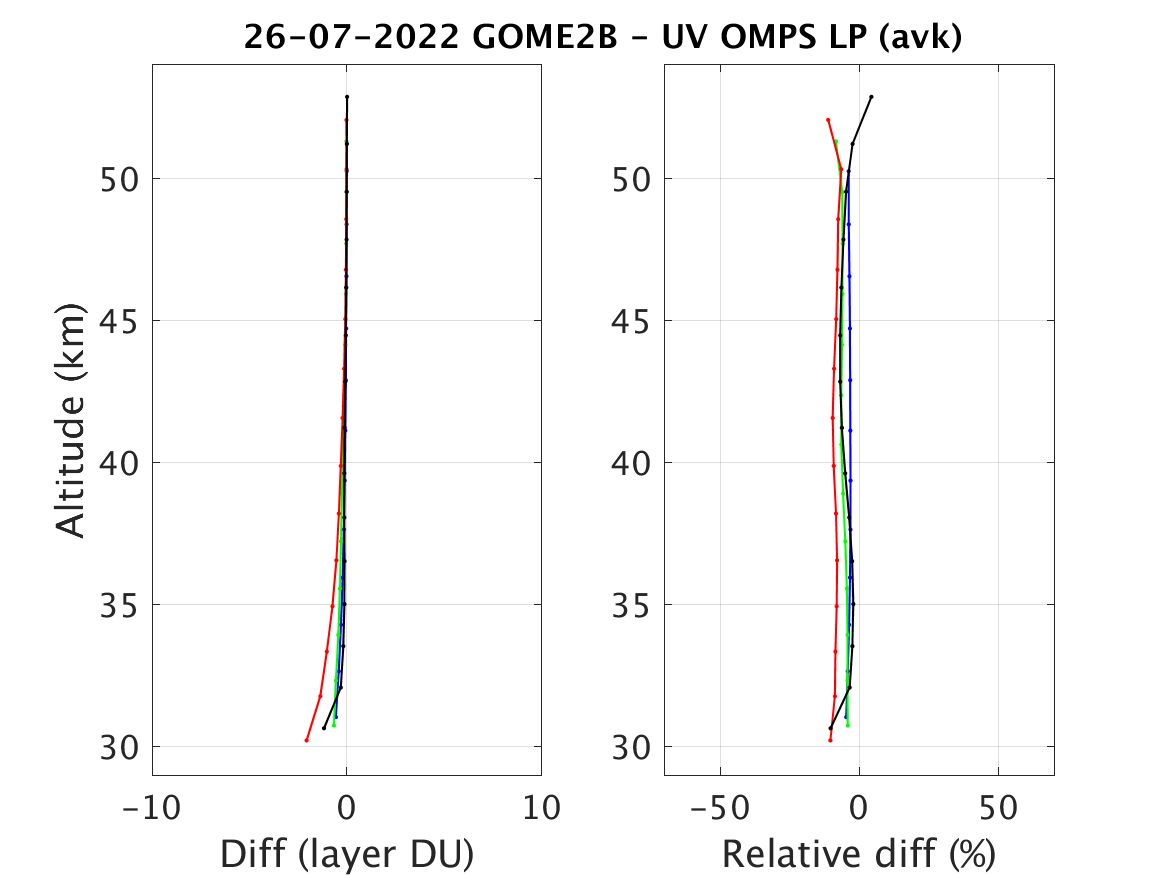 |
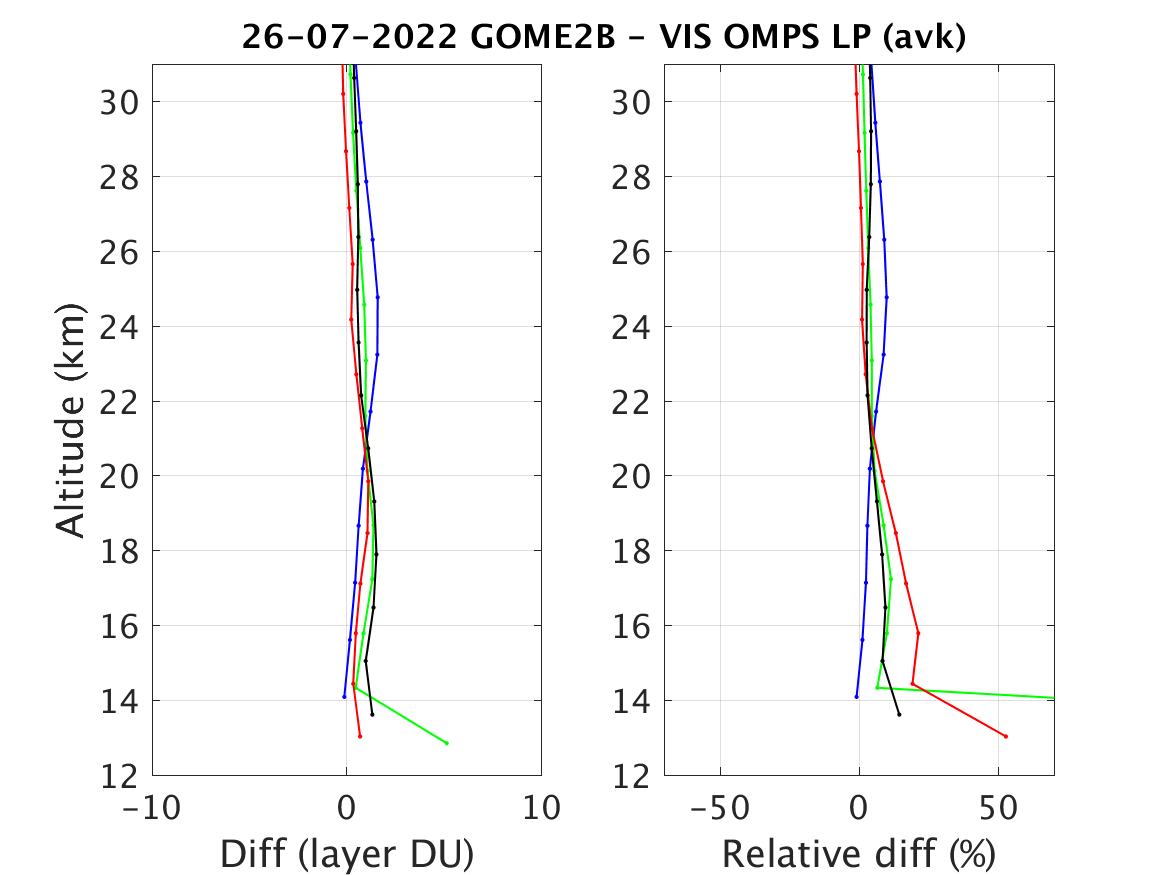
| Figure 3. Left: GOME-2B - VIS OMPS. Right: (GOME-2B - VIS OMPS) / VIS OMPS. VIS OMPS ozone profiles are smoothed with GOME-2 averaging kernels (avk). | Figure 4. Left: GOME-2B - UV OMPS. Right: (GOME-2B - UV OMPS) / UV OMPS. UV OMPS ozone profiles are smoothed with GOME-2 averaging kernels (avk). |
Metop-C
Data:- GOME-2/Metop-C Offline high-resolution vertical ozone profile product OHP
- OMPS Limb Profiler - Suomi NPP LP-L2-O3-DAILY Version 2.5 product (center slit) having separate retrievals for the upper troposphere and lower stratosphere (VIS) and for the middle and upper stratosphere (UV)
| The map of collocated pixels | The mean profiles in five latitude zones |
|---|---|
 |
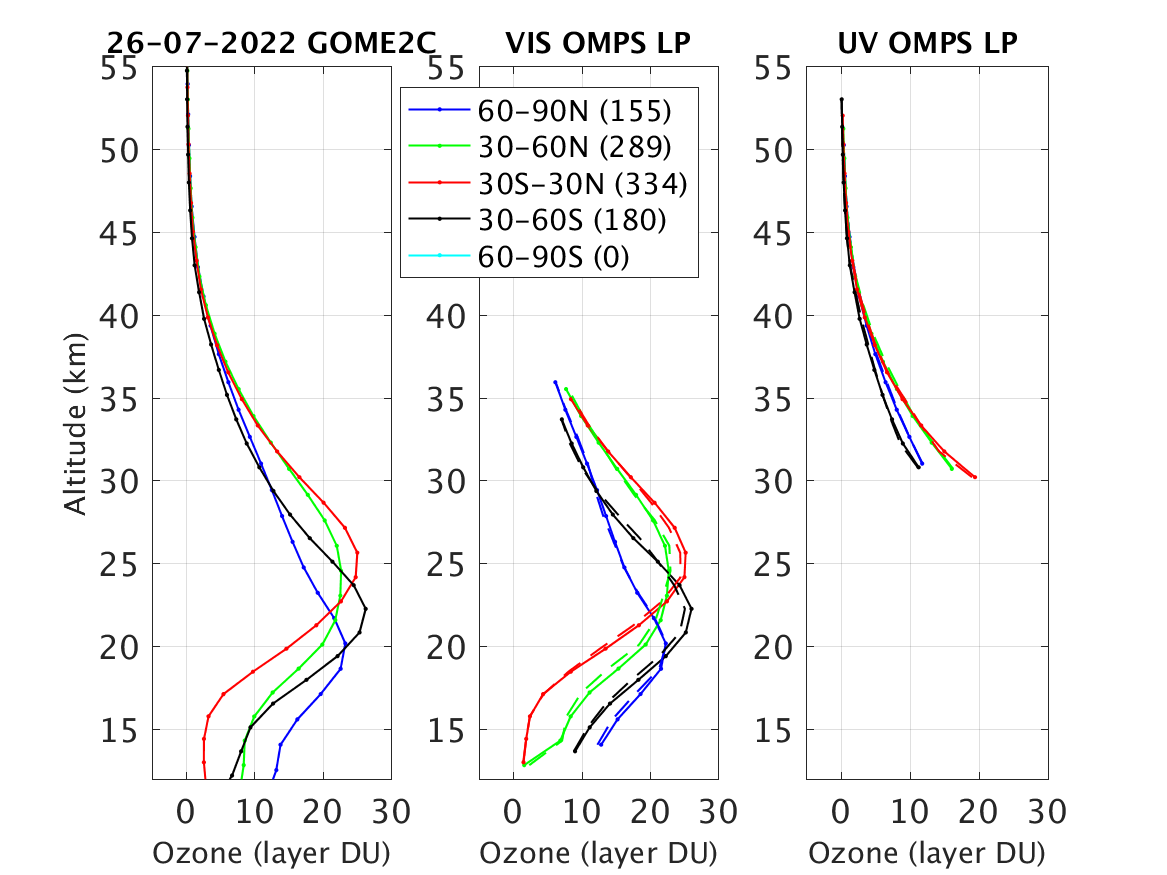 |
| Figure 1. Collocation criteria: observations within 12 hours and distance between them is less than 200 km on WGS 84 ellipsoid. | Figure 2. Legend box shows the number of collocations at each latitude zone. Middle and right: The solid curves are for the means of OMPS LP profiles smoothed vertically with GOME-2 averaging kernels and dashed curves without smoothing. |
| The absolute and relative difference of daily means in five latitude zones | |
 |
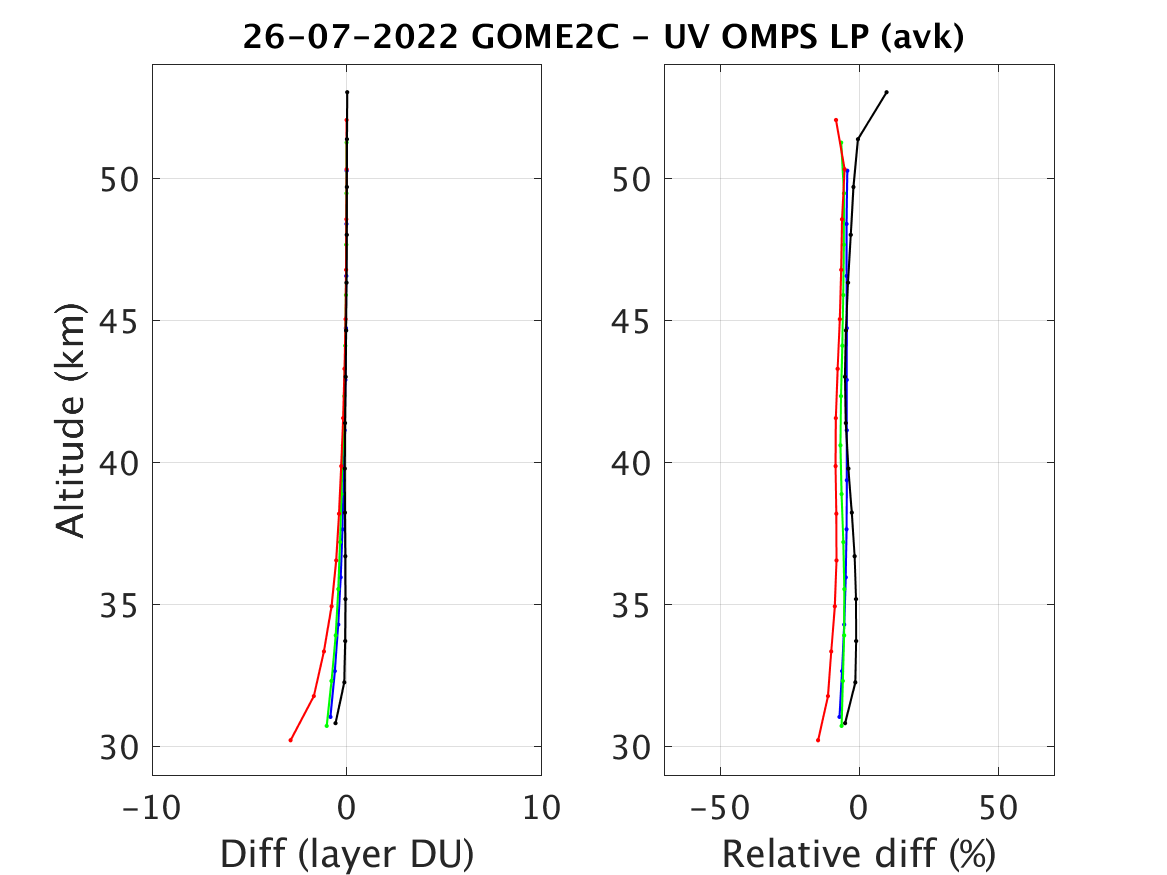 |
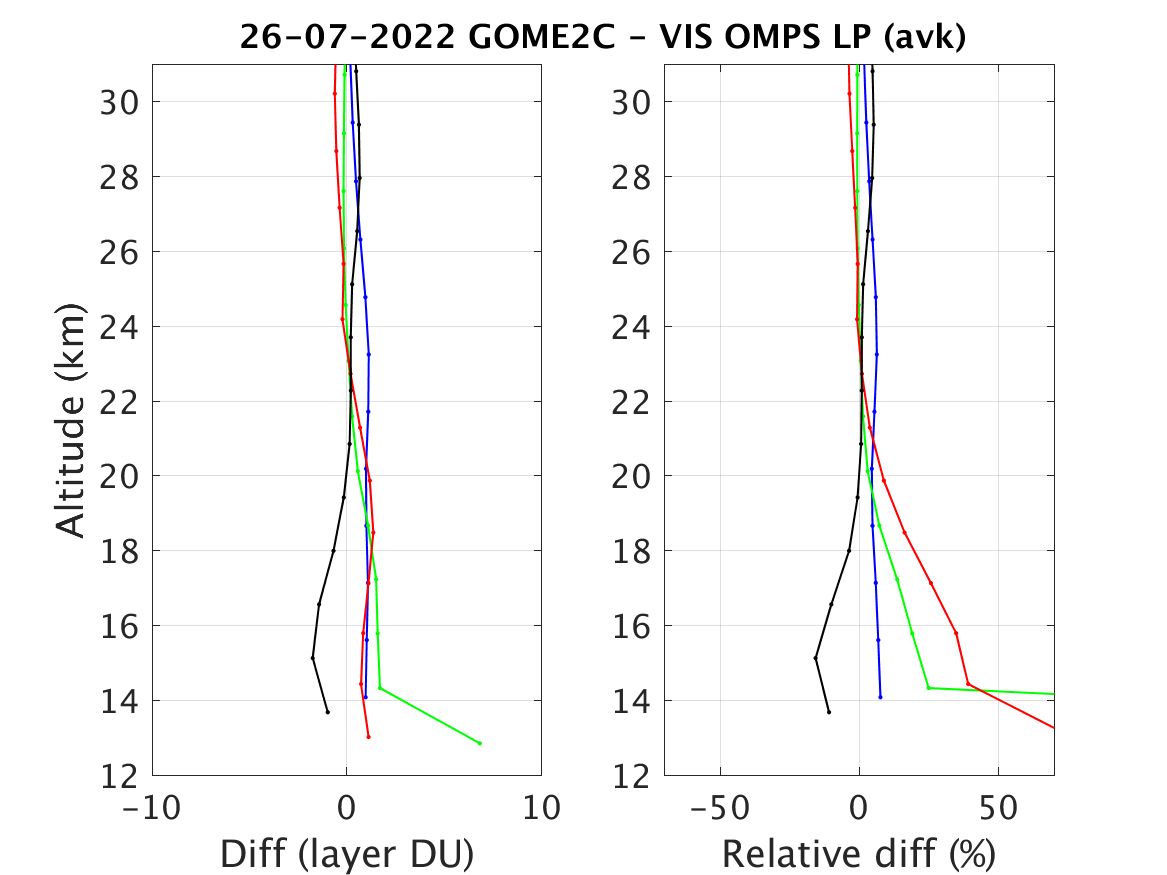
| Figure 3. Left: GOME-2C - VIS OMPS. Right: (GOME-2C - VIS OMPS) / VIS OMPS. For comparison the VIS OMPS ozone profiles are smoothed with GOME-2 averaging kernels (avk). | Figure 4. Left: GOME-2C - UV OMPS. Right: (GOME-2C - UV OMPS) / UV OMPS. For comparison the UV OMPS ozone profiles are smoothed with GOME-2 averaging kernels (avk). |
Acknowledgement: OMPS LP version 2.5 ozone profile data are produced by the LP processing team (DOI: 10.5067/X1Q9VA07QDS7).