2025:
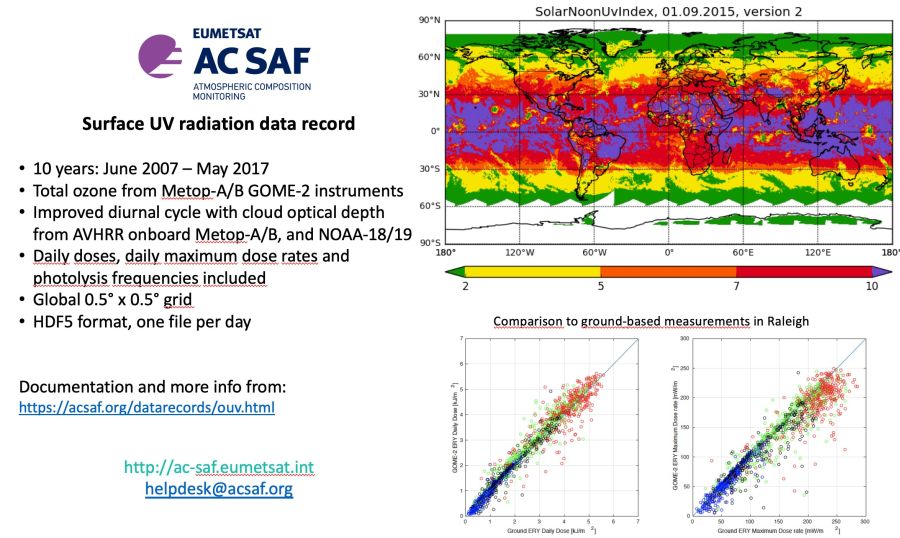
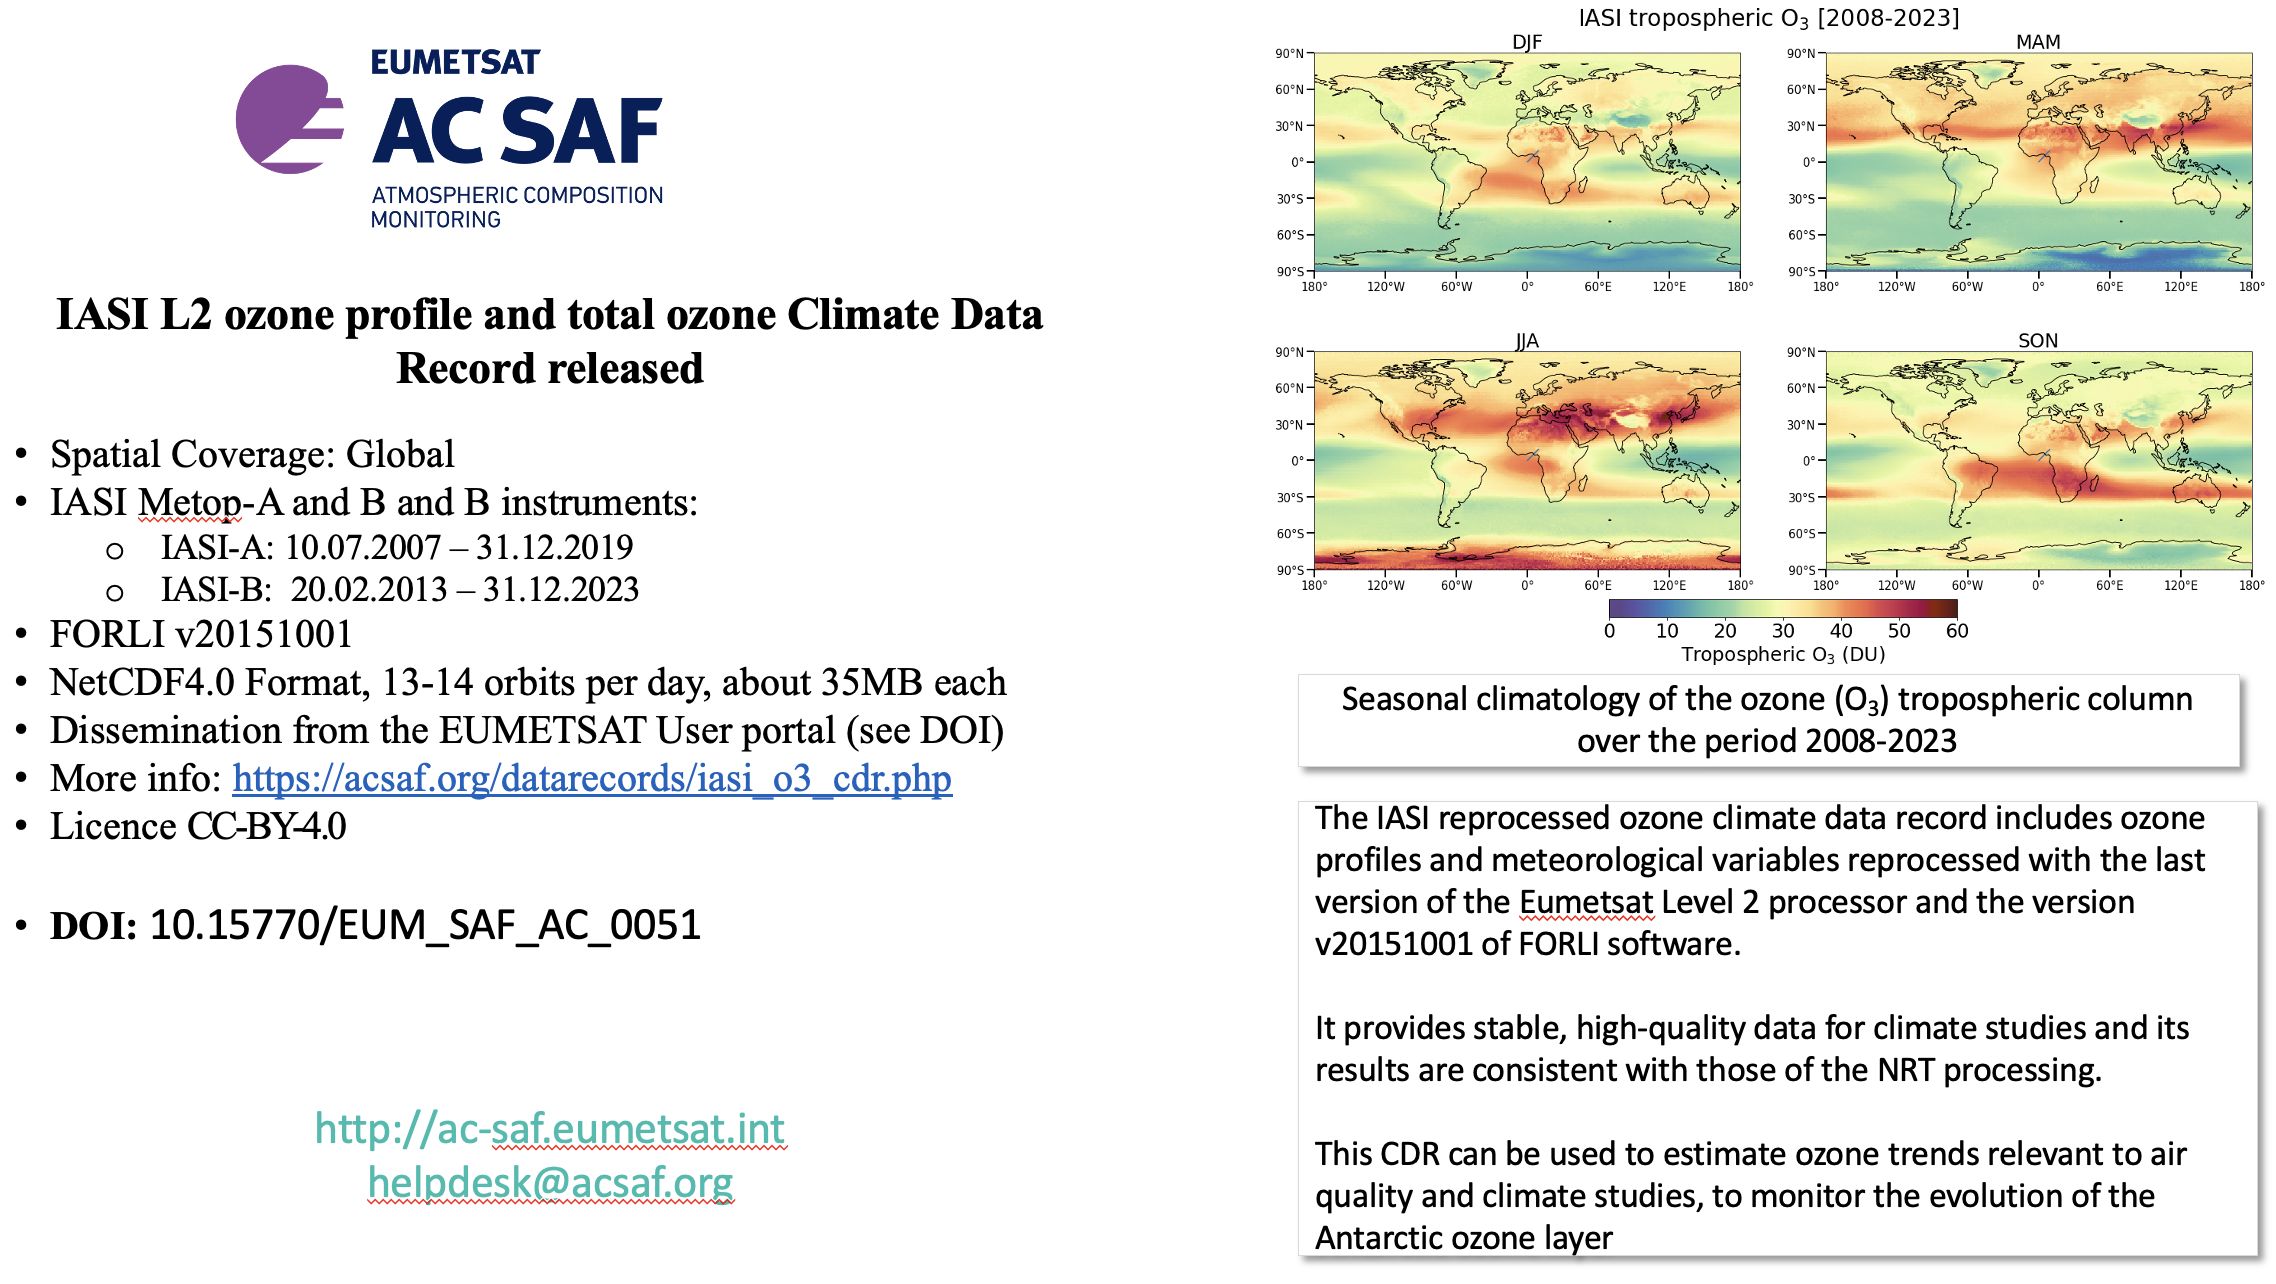
IASI L2 ozone profile and total ozone climate data record has been released
The product is available from EUMETSAT Data Store in NetCDF format, see more info here.
Image: ULB/LATMOS
Global 1-day UV index forecast product is available
The product is available from DMI website in NetCDF format, see more info here.
Image: DMI

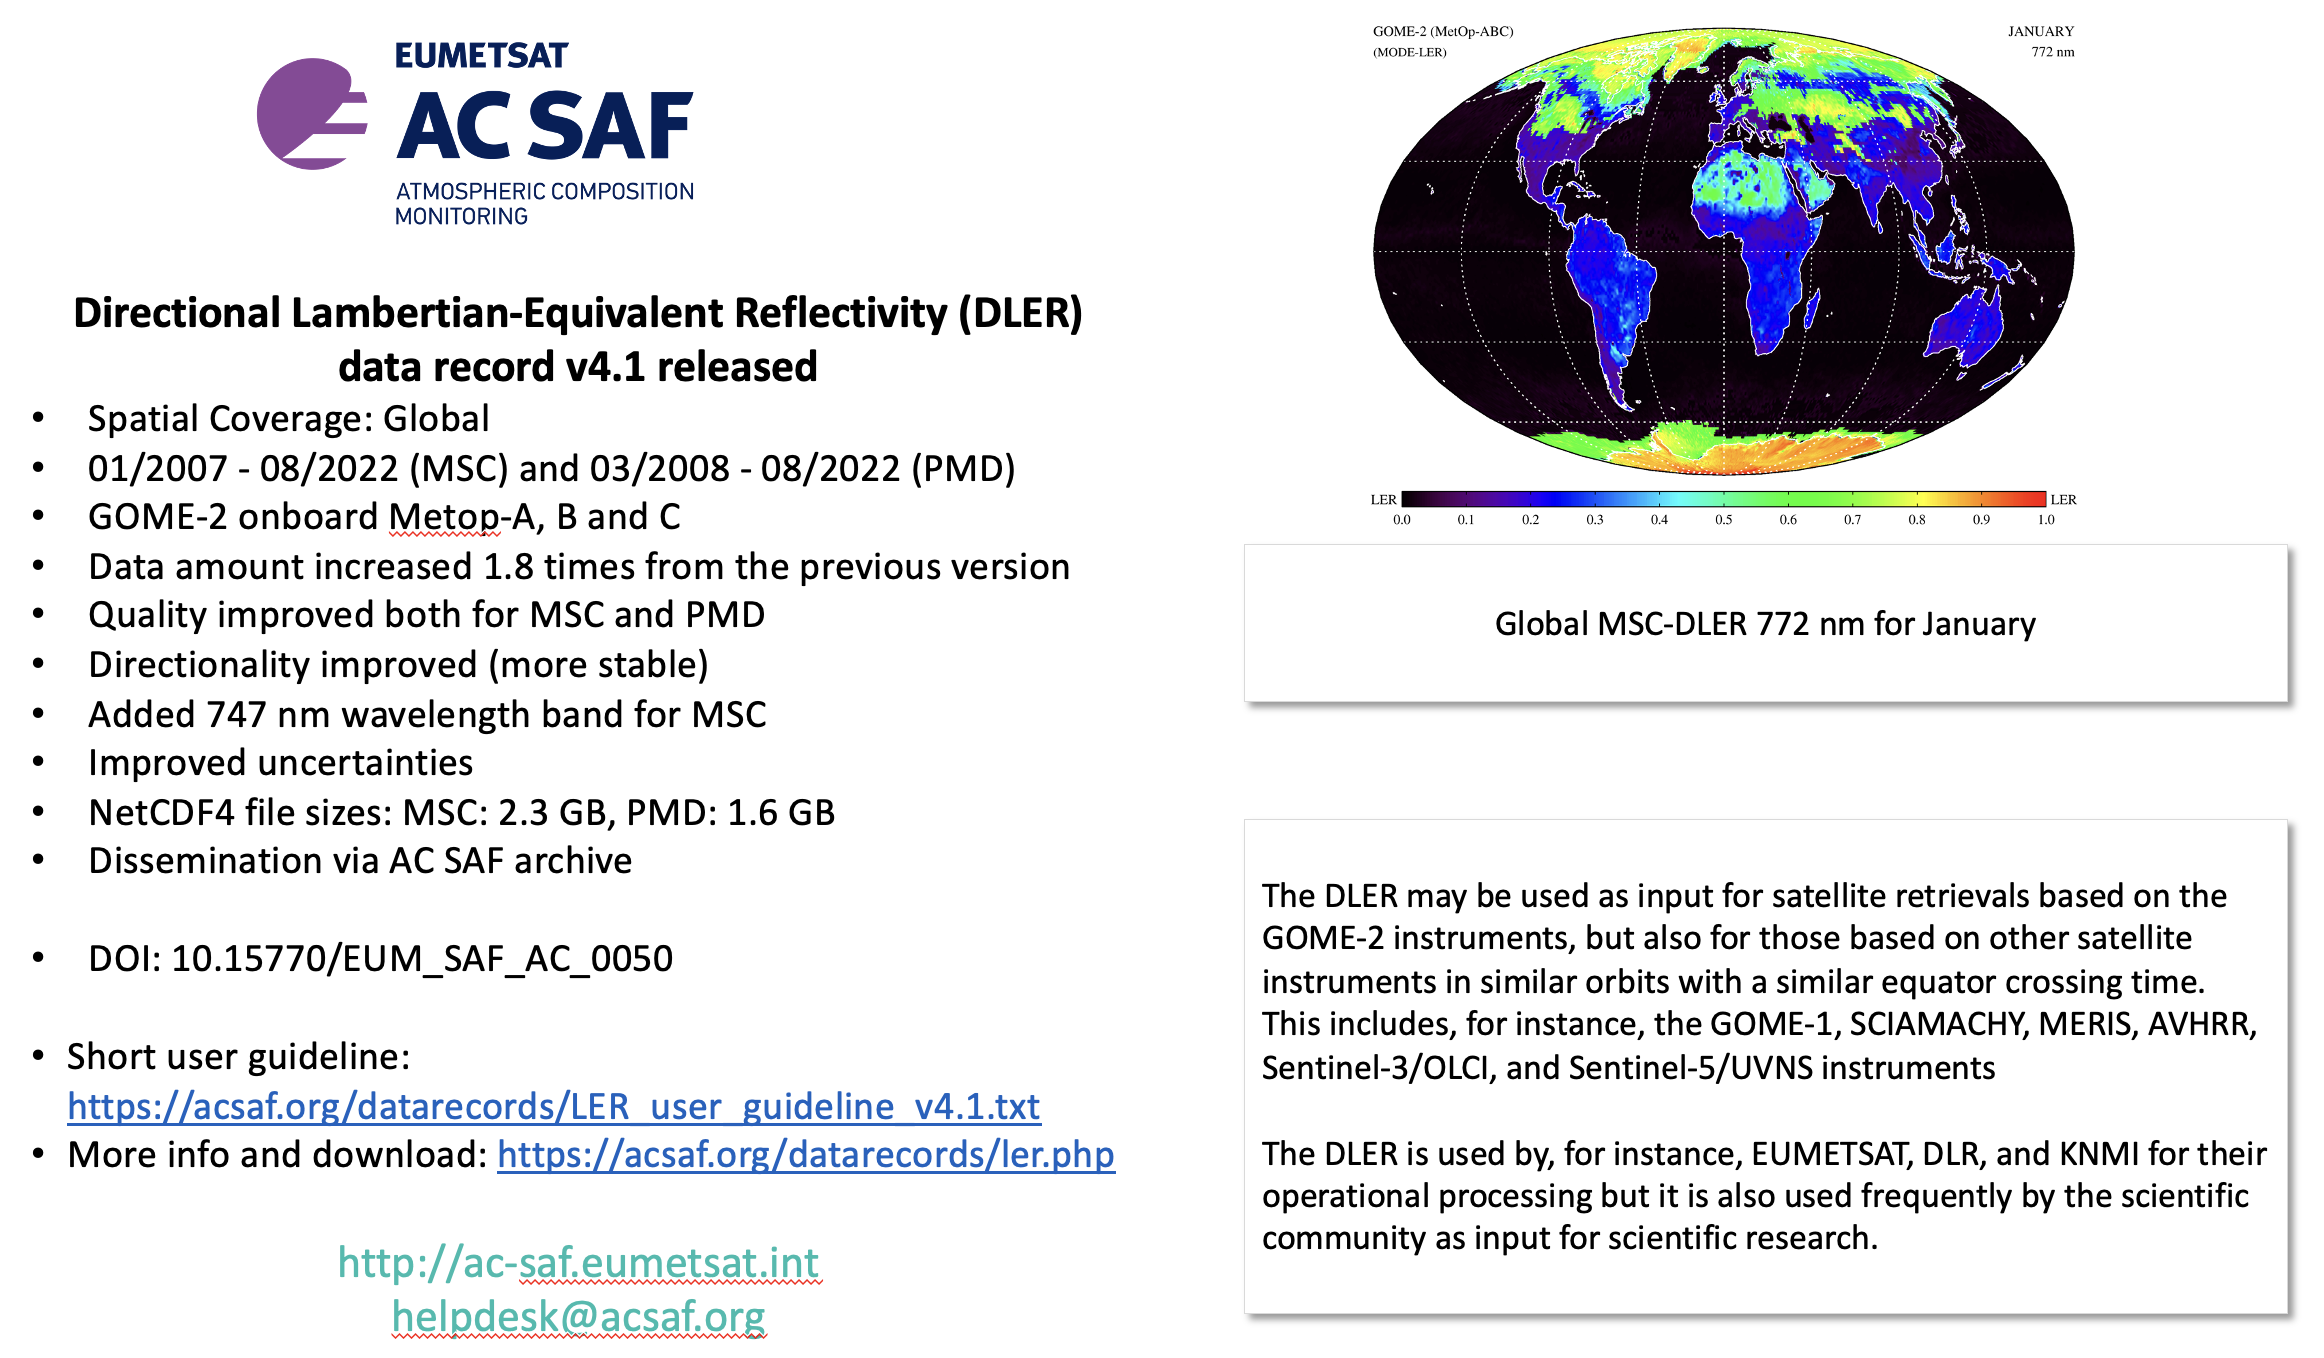
Lambertian-equivalent reflectivity data records (v4.1) have been released
The data records are available from AC SAF data archive in NetCDF format, see more info here.
Image: KNMI
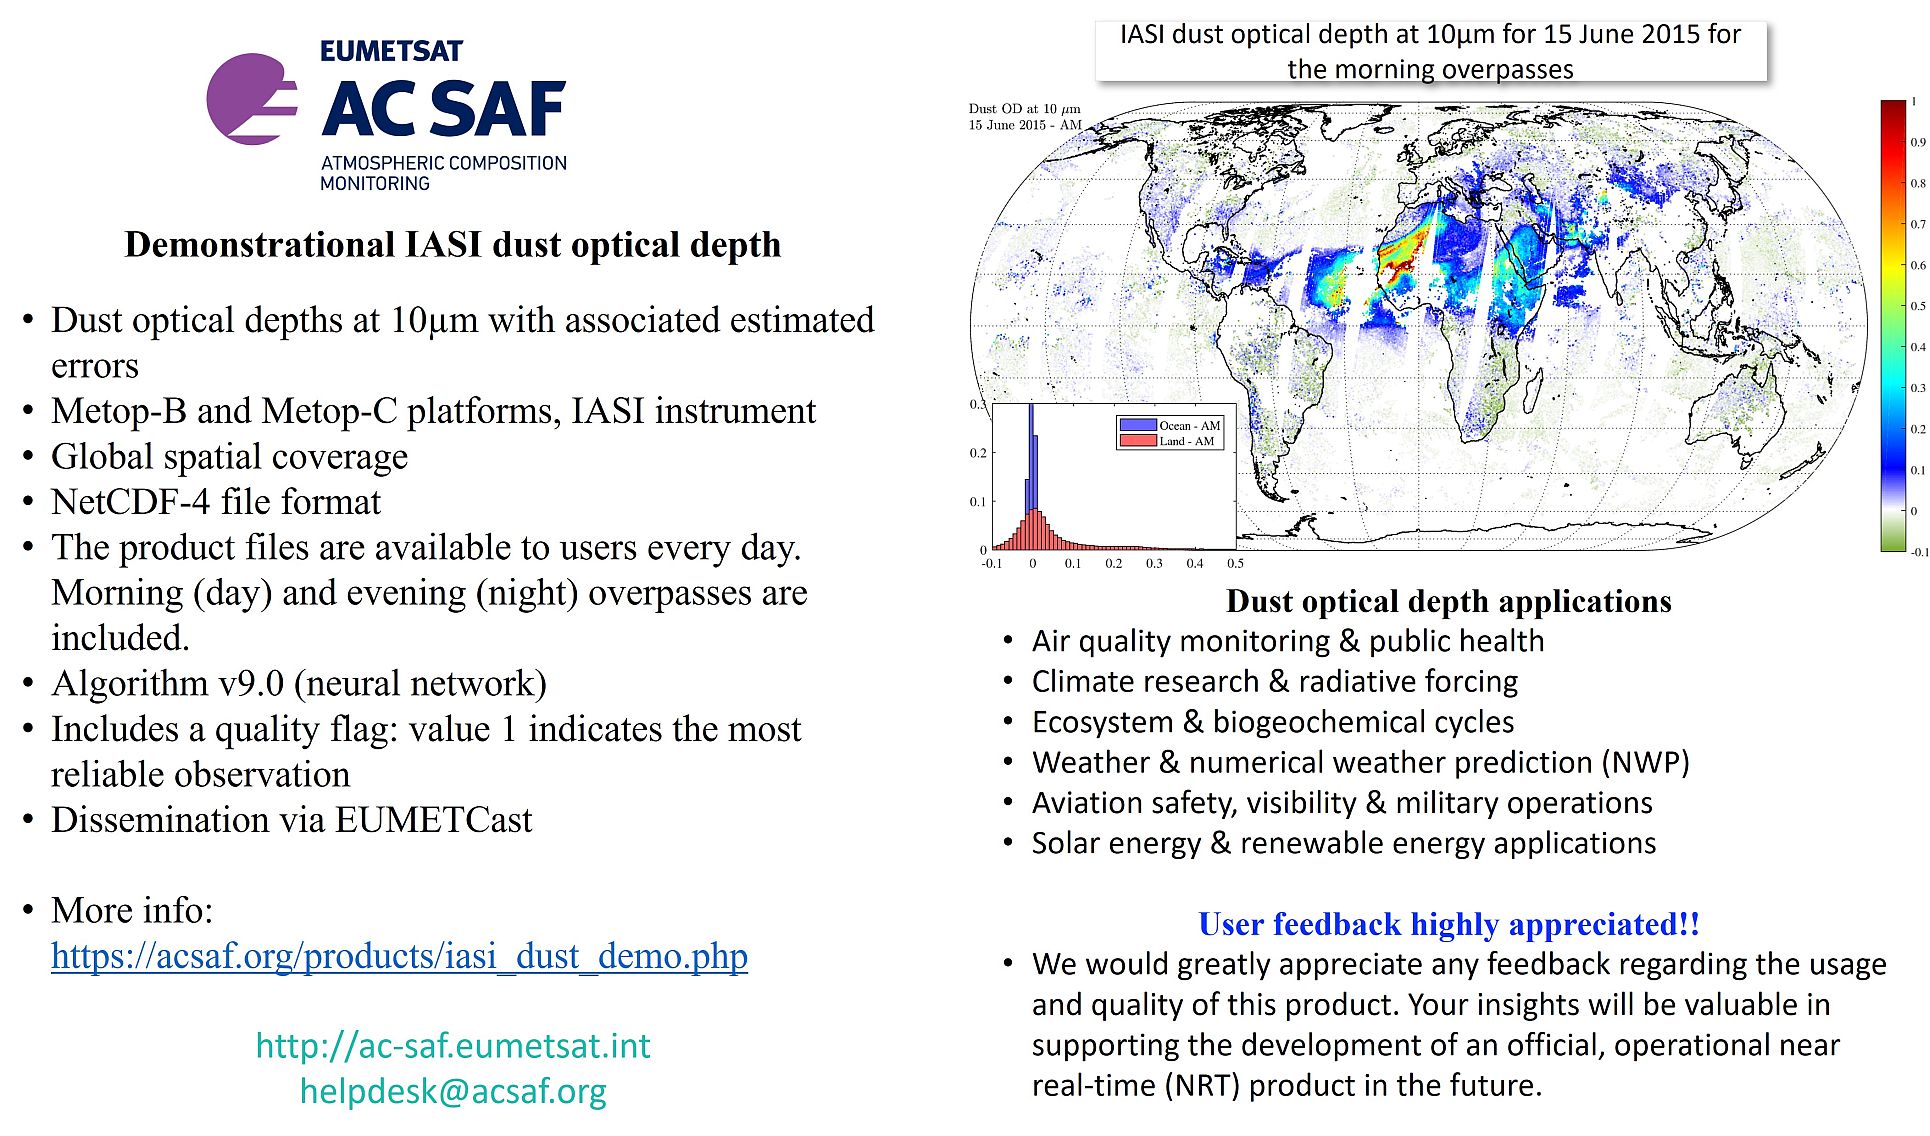
Demonstrational daily IASI dust optical depth product is available
The product is available via EUMETCast in NetCDF format, see more info here.
Image: ULB/LATMOS
2024:
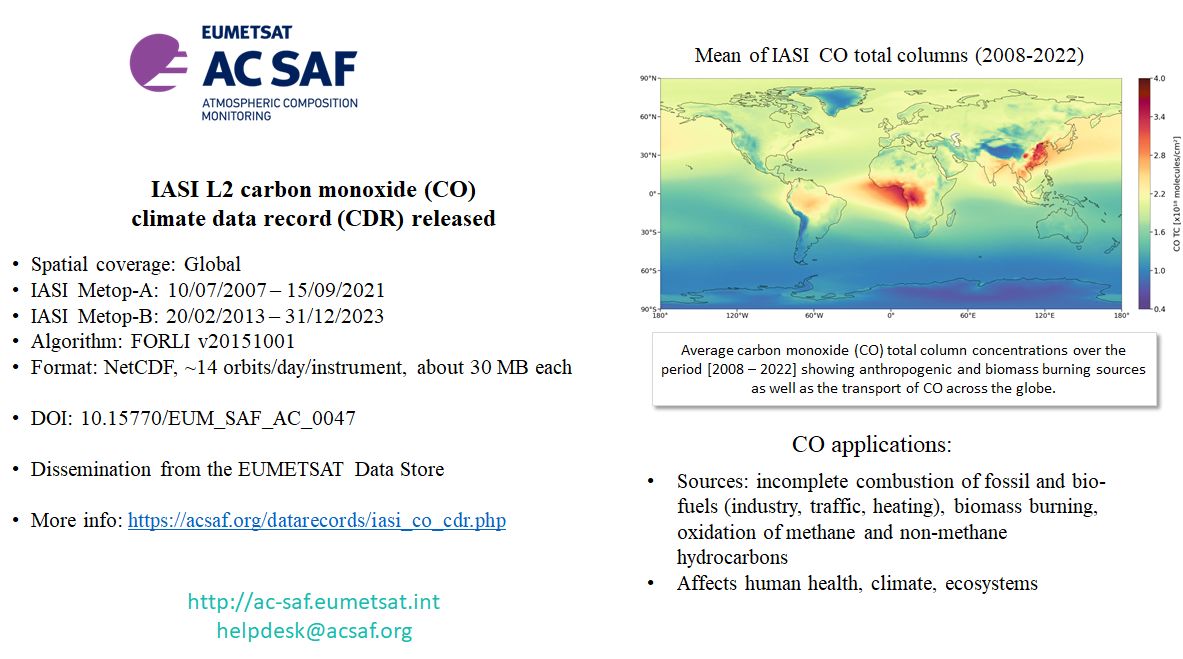
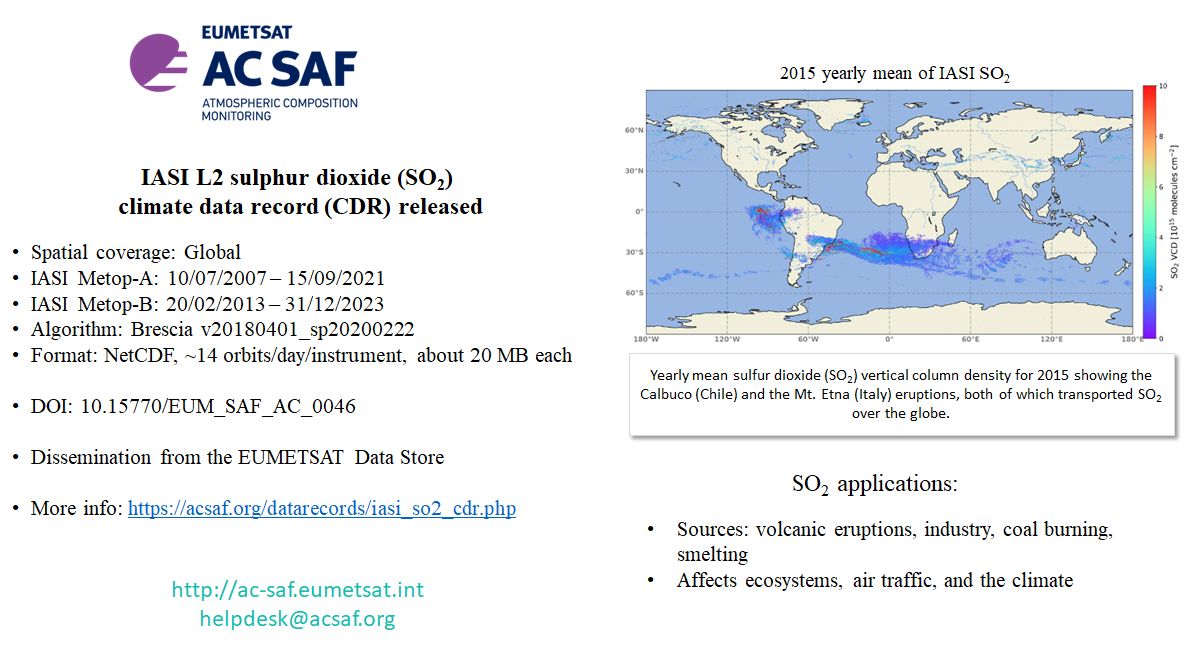
IASI level 2 CO and SO2 climate data records (CDRs) are available
The CDRs are available from EUMETSAT Data Store in NetCDF format, see more info: IASI L2 CO CDR and IASI L2 SO2 CDR
Images: ULB/LATMOS
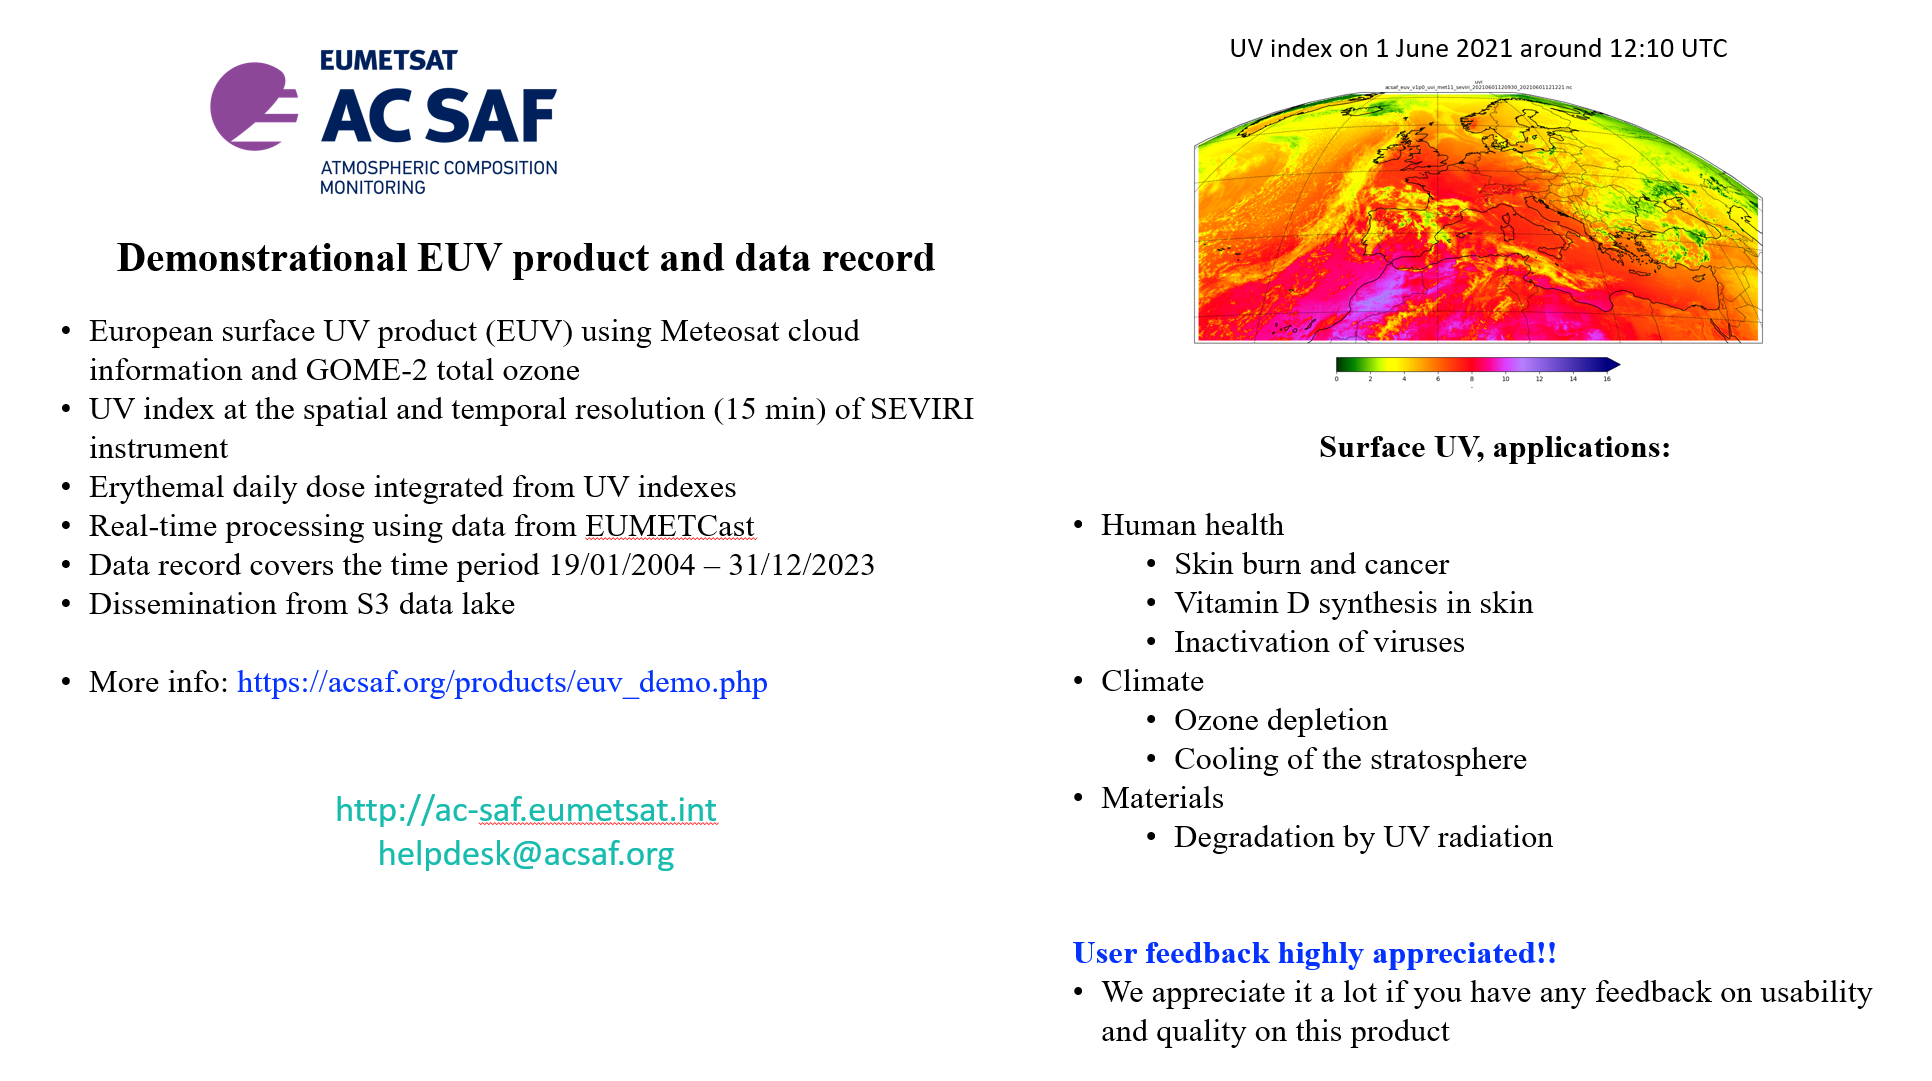
Demonstrational European UV product (EUV) available
The product is available from S3 cloud archive in NetCDF format, see more info here.
Image: FMI
2023:
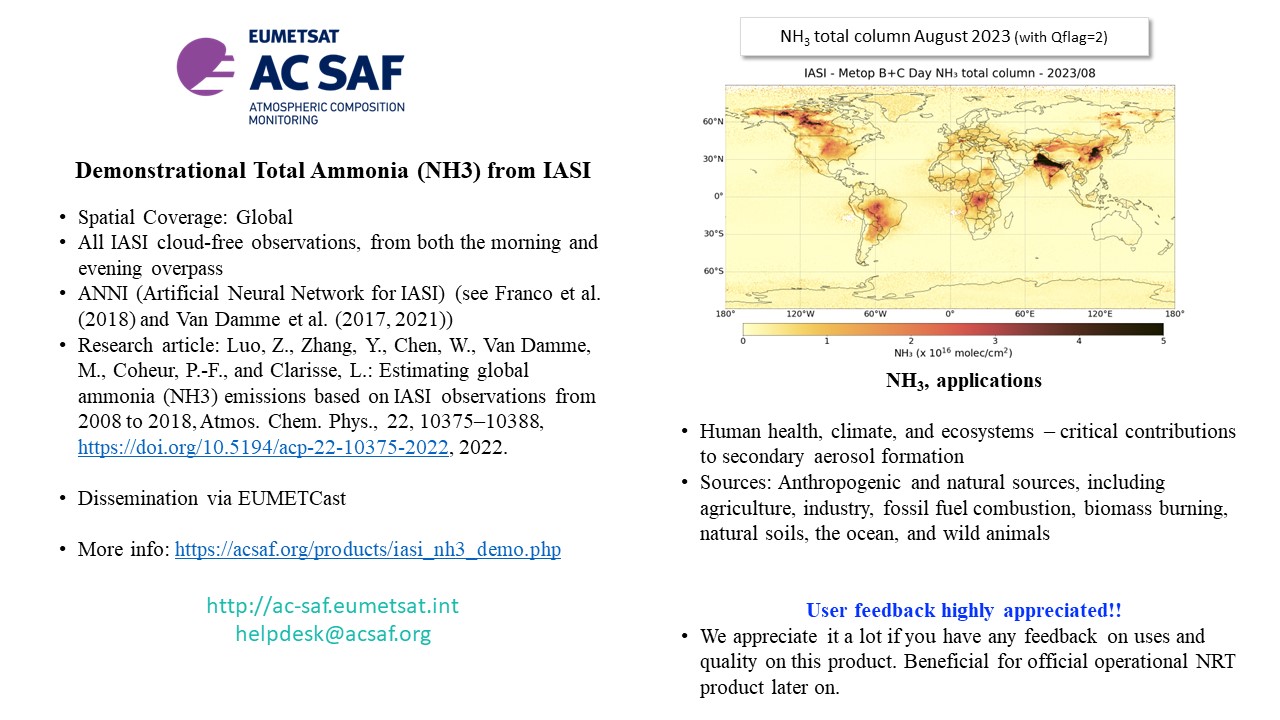
Demonstrational IASI total ammonia (NH3) available
Demonstrational IASI NH3 total column is a daily product with global coverage.
The productc is available via EUMETCast in NetCDF format, see more info here.
Image: LATMOS
Smoke plumes over North-East USA
IASI CO observations from last week show the smoke plumes from Canada wildfires passing over North-East USA. Air quality in the city of New York reached hazardous levels.
AC SAF IASI CO data is available in near real-time via EUMETCast, see more info here.

2022:
Ozone hole above Antarctica
The ozone hole is developing above Antarctica. The animation shows the area of the ozone hole and the minimum value measured with the GOME-2 instrument for the period 1 August - 17 December 2022.
GOME-2 can't observe ozone during the polar night, therefore the data around the pole are missing up to the 22 September. Due to the data gap, the size and depth of the ozone hole are underestimated until then.
Animation: DLR

2021:
Ozone hole above Antarctica
The ozone hole is developing above Antarctica. The animation shows the area of the ozone hole and the minimum value measured with the GOME-2 instrument for the period 1 August - 16 December 2021.
Animation: DLR

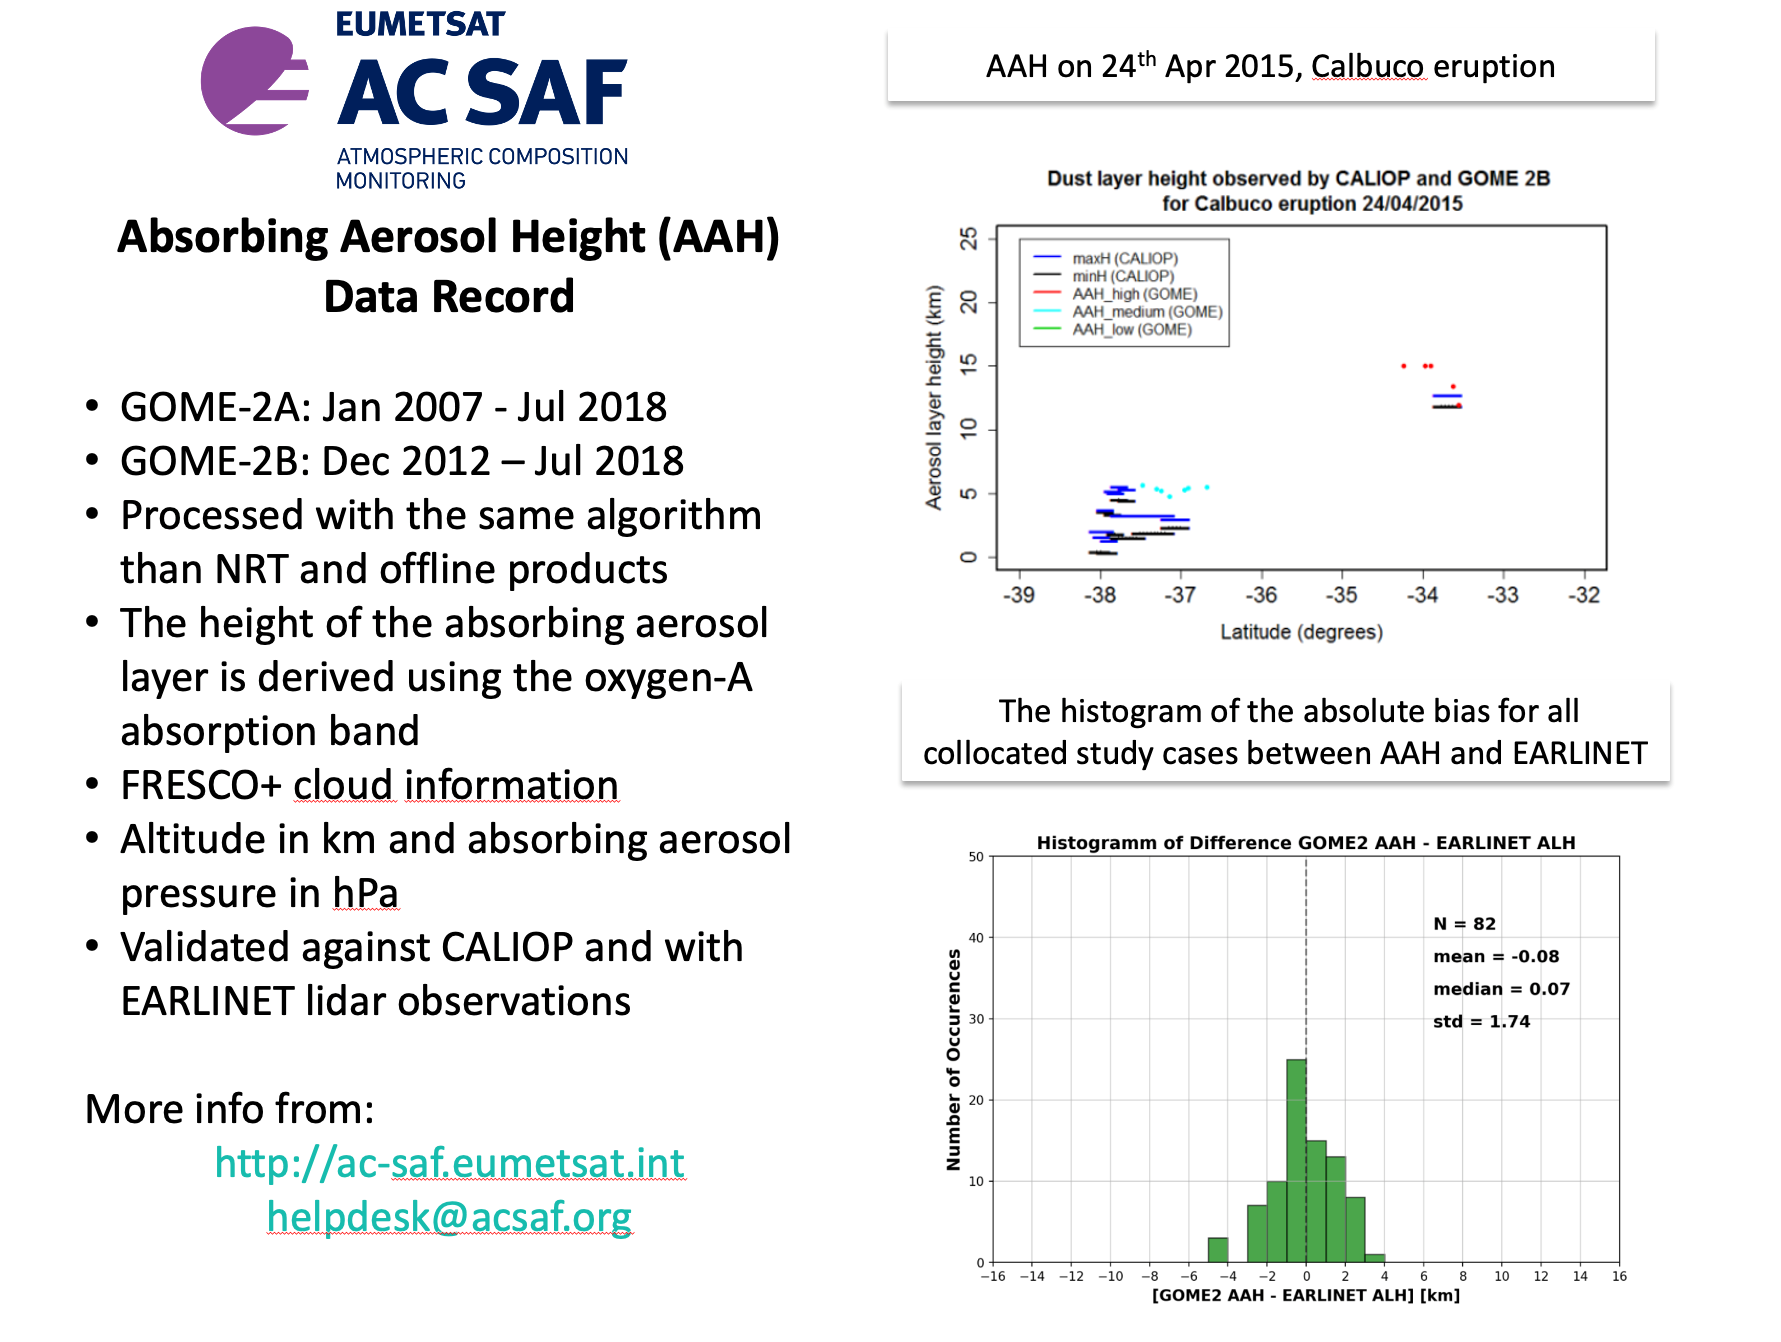
Absorbing aerosol height data record released
The Absorbing Aerosol Height data record, providing information on the height of absorbing aerosol layers, is now available.
2020:
Antarctic ozone hole, observed minimum less than 100 DU
Ozone hole area over Antarctica developed quite slowly in the fall 2020 but later on, at the beginning of October, lowest values less than 100 DU were observed. The same feature was seen also with the size of the affected area. The size of the hole was quite small at the beginning of the season but increased towards October quite rapidly. The animation show the size of the ozone hole area 1 August - 5 October 2020 together with variation since 2007.
Animation of the AC SAF vertical ozone column measured by GOME-2 instruments onboard Metop satellites and processed at DLR:

Spring time ozone depletion in the Arctic
Usually the ozone hole is in the Antarctic in spring. This year, due to special meteorological conditions, an ozone depletion is observed also over the northern polar region.
Animation of the vertical ozone column measured by GOME-2 instruments onboard Metop satellites:
Surface UV data record released